01
Forward + backward
Pick any node — the whole chain illuminates in both directions. R5 implementing? Find every spec, test, release.
Traceability Graph
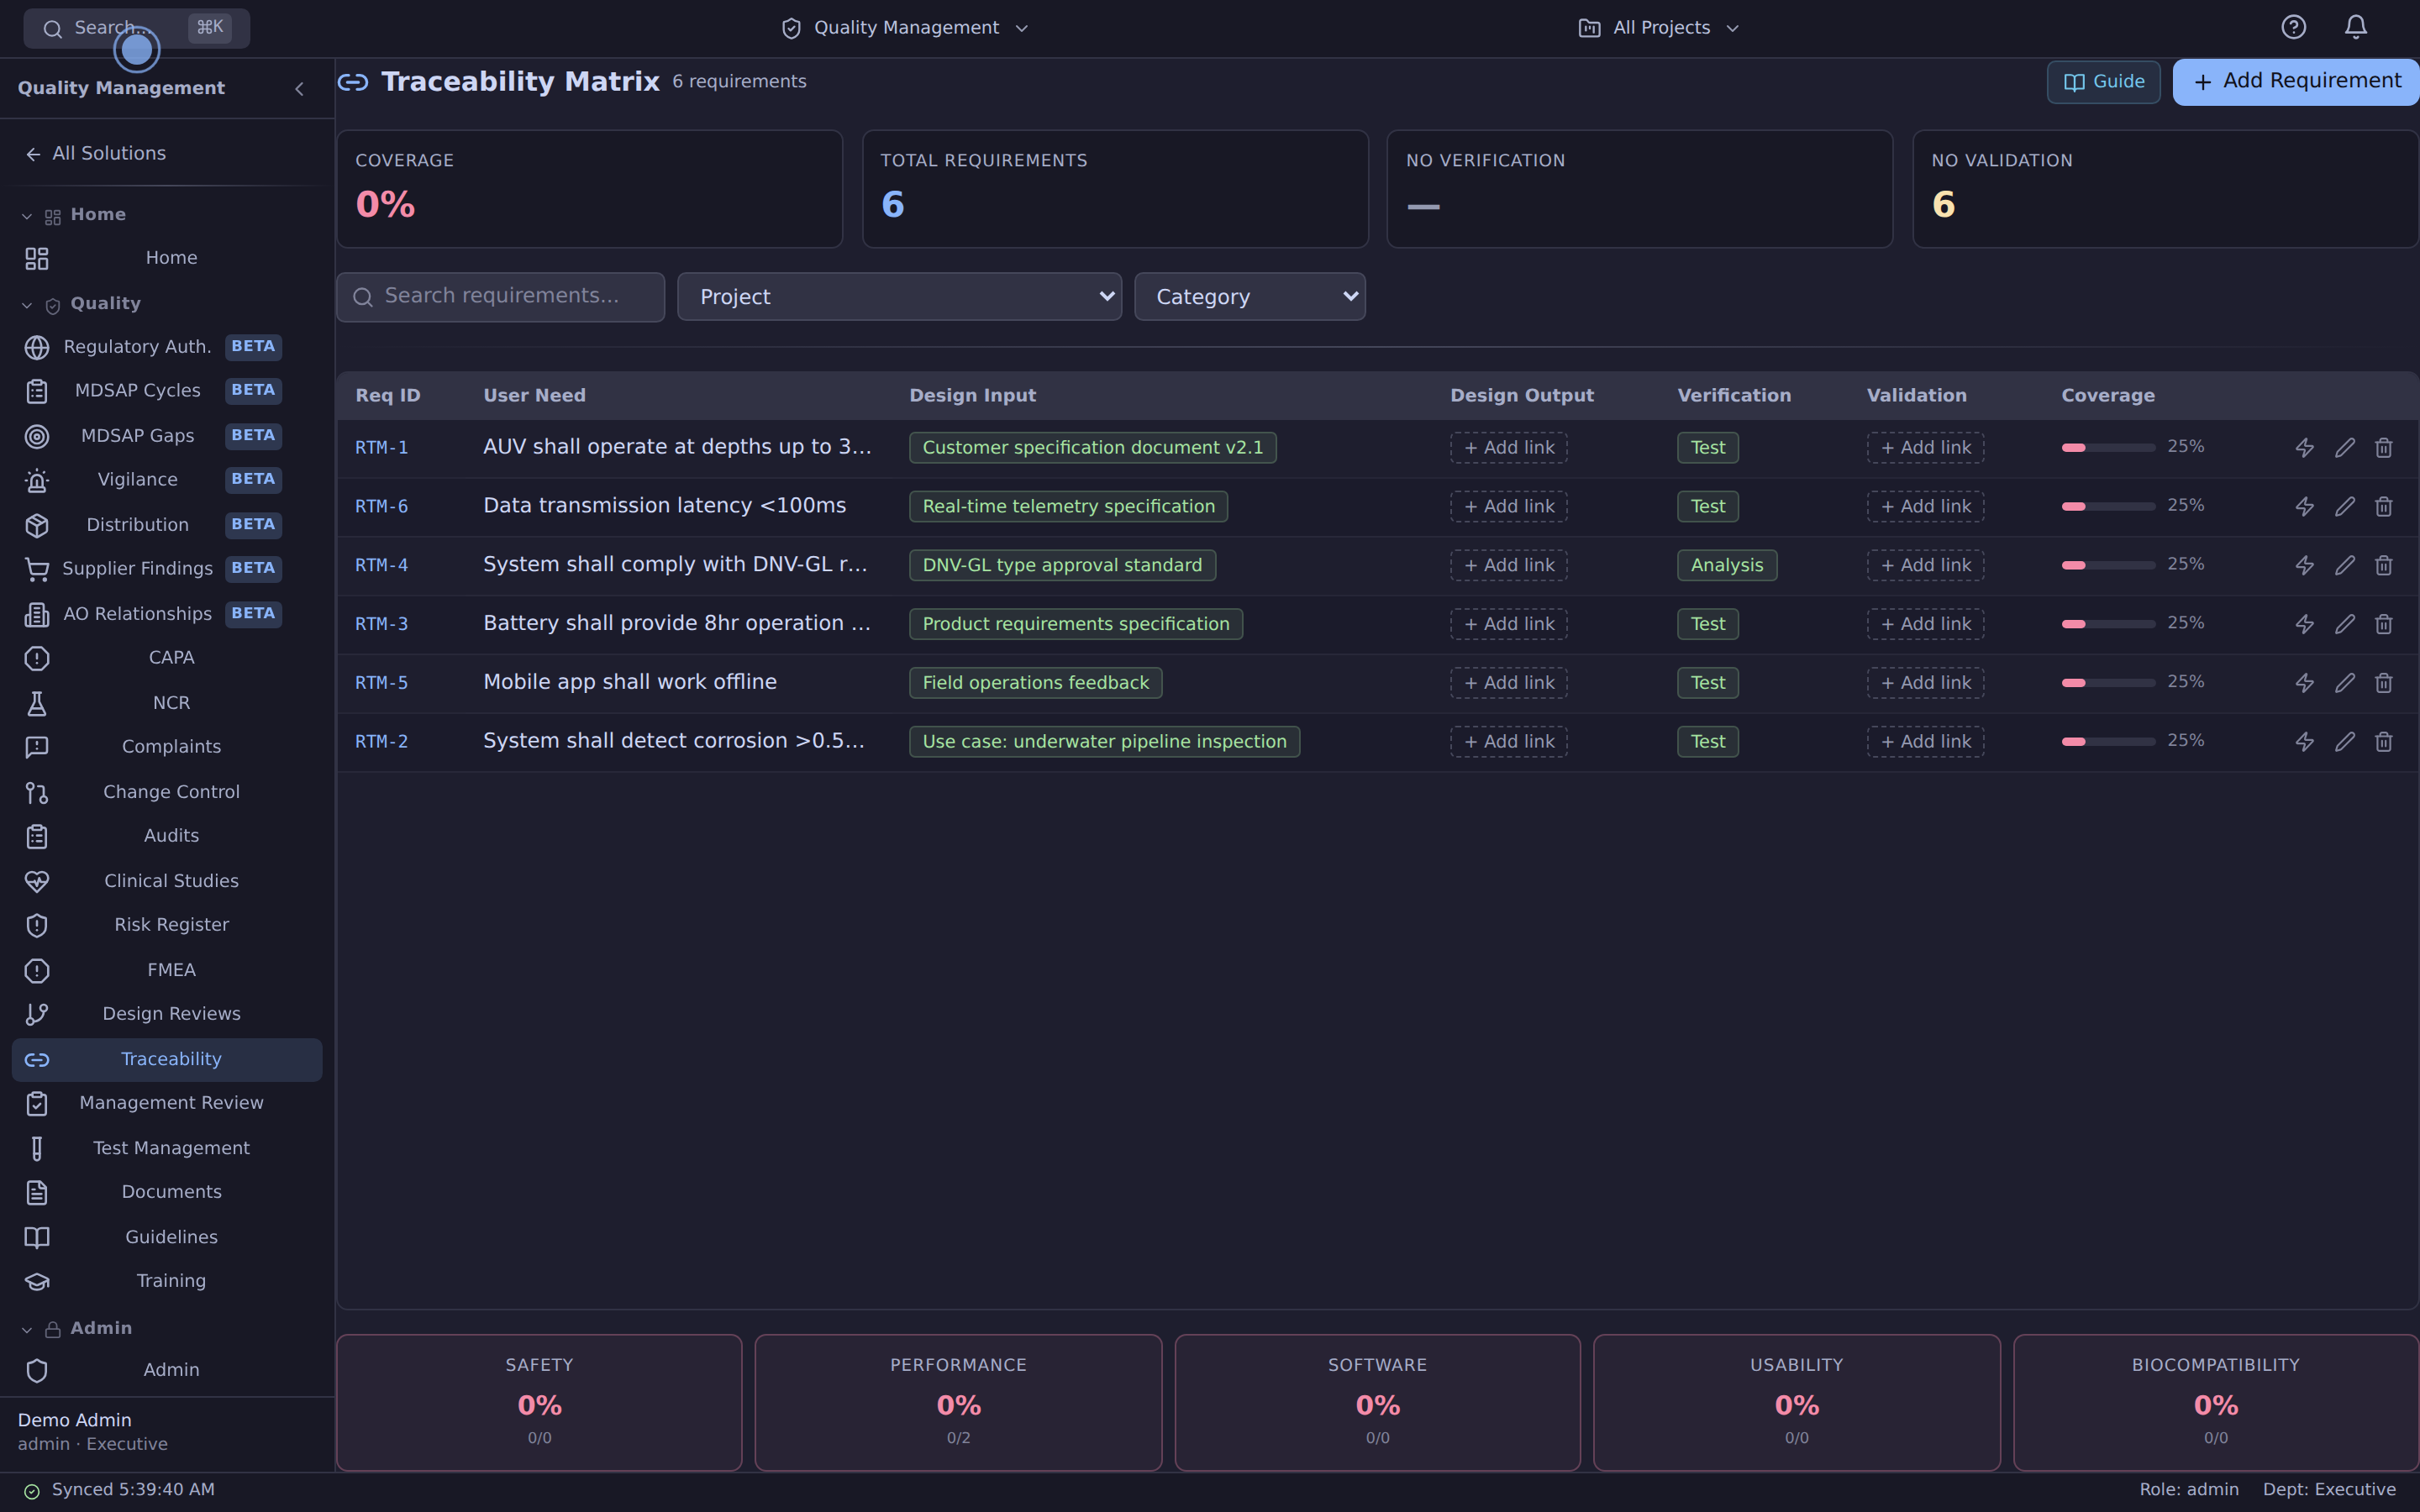
Build audit-supporting traceability from the links teams make during normal work. Follow requirements forward to specs, tests, and releases—or backward from a release to its source evidence.
Read-only demo · no signup · realistic seeded records
Why this matters
Most teams maintain traceability matrices by hand in a spreadsheet that's perpetually six months stale. Azora generates the matrix from links you make as part of normal work — every spec references the requirement it implements, every test references the spec it verifies, every release references the tests it includes.
01
Pick any node — the whole chain illuminates in both directions. R5 implementing? Find every spec, test, release.
02
4-column grid (Req → Spec → Test → Release). Hover to highlight chains. Click to filter to one chain.
03
Surface requirements with no spec, specs with no test, tests with no release. Each row is a TODO.
04
One requirement can produce many specs. One spec can be verified by many tests. The graph captures real-world structure.
05
Generate the full matrix as PDF for review or an audit request. No manual spreadsheet maintenance.
06
When you add a test that references a spec, the matrix updates instantly. Always live; never stale.
Connected workflow
Azora brings project work, quality, people, suppliers, units and documents into one platform. Review the records and relationships your process needs.
Pick any node — the whole chain illuminates in both directions. R5 implementing? Find every spec, test, release.
4-column grid (Req → Spec → Test → Release). Hover to highlight chains. Click to filter to one chain.
Surface requirements with no spec, specs with no test, tests with no release. Each row is a TODO.
One requirement can produce many specs. One spec can be verified by many tests. The graph captures real-world structure.
“I used to maintain the trace matrix in a spreadsheet — three days a release, every release. Now it's a graph view that builds itself from the link picker. I haven't opened the spreadsheet in two months.”
Review the current platform offering and talk through your team size, configuration and onboarding needs. View platform pricing.
See it before you talk to sales
The demo tenant includes sample requirements, specs, tests, and releases so you can explore the graph view immediately.